Having had the latest beta for a day I thought I’d present some benchmark results along with the methodology to recreate the test results for other beta testers in the hope that they will use this as a guide and share their results with the community.
For this test I used the following image which is freely available from UnSplash - the size of the original image is ‘Original Size - 4000 x 5000’
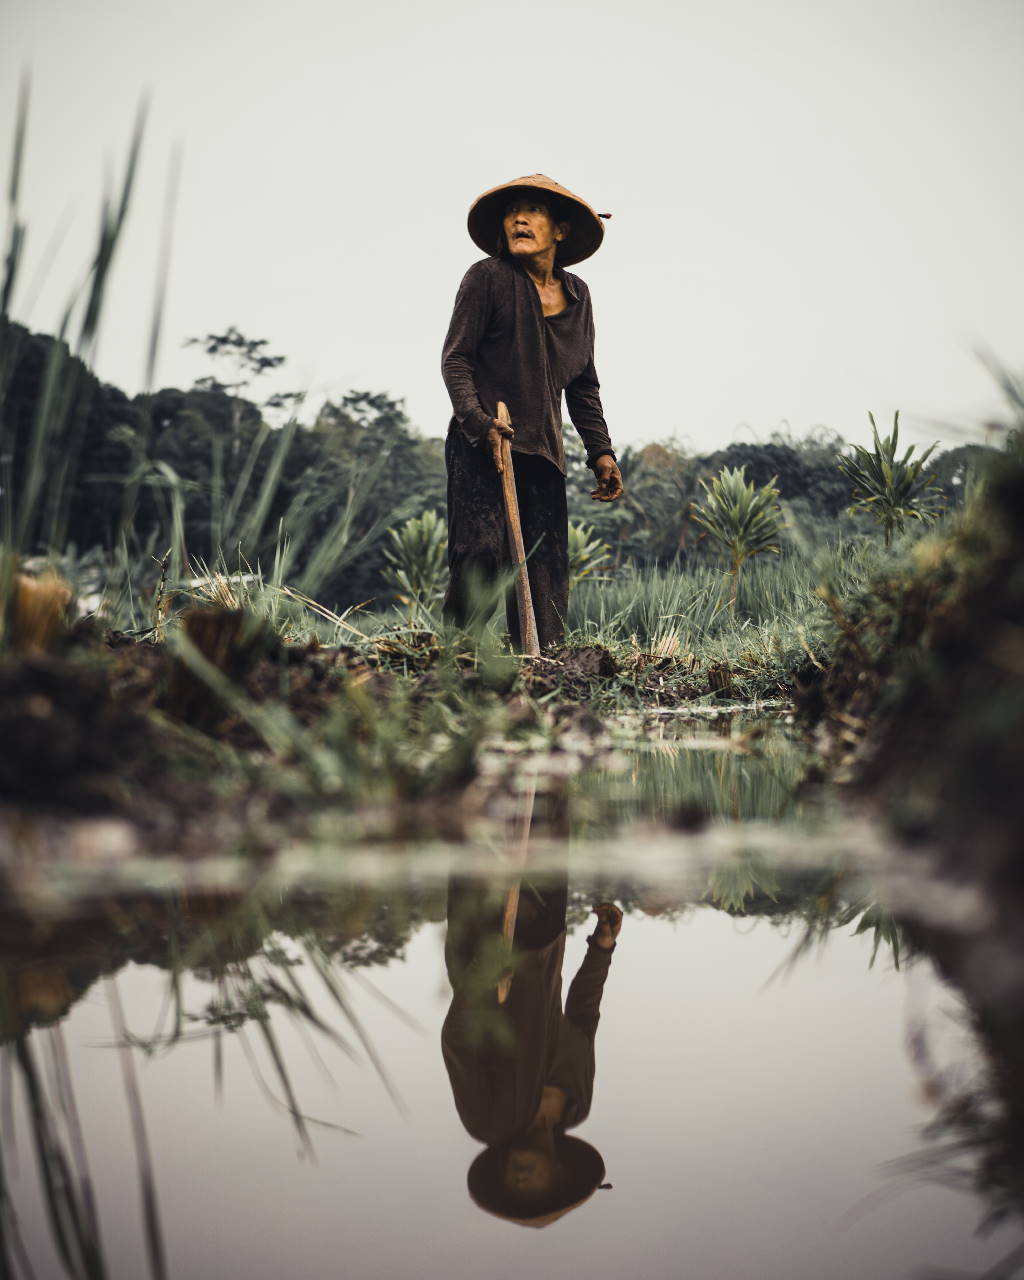
Attribution : Photo by Visual Karsa on Unsplash
For those of you who only want the numbers this test is a batch conversion of the above image at using a chunk size of 2048 and ‘Level of Detail’ set to ‘Very HIgh’ using CPU. These settings are chosen so as to be high enough to take a lot of processing and a fair amount of time to be meaningful without taking overly long.
The results for a full batch of 122 images with output resolution of 1536 x 1920…
MacBook Pro - Late 2013 - 13 inch
CPU - 2.8Ghz Intel i7-4558U
Graphics - Intel Iris 5100 (Shared Memory - 1636Mb)
Memory - 8Gb DDR3 1600Mhz (2x 4Gb)
OS - MacOS 11 Big Sur (Still supported for next MacOS 12 Monterrey)
Runtime - 0:24:22.769

Dell Inspiron 17 7746 Touchscreen - 2015
CPU - 2.4Ghz Intel i7-5500U
Graphics - Intel HD 5500 (PC also has a non-functioning nVidia 845M)
Memory - 16Gb DDR3L 1600Mhz (2x 8Gb)
OS - Windows 10 Pro (Not supported by Windows 11)
Runtime - 0:31:30.083

Same DELL under WSL***
OS - Ubuntu 20.04 WSL2 session via x410 / Windows 10 Pro
Runtime - 0:43:24.720
*** WSL allows you to run Linux stuff under Windows 10, the downside being that Windows is still running which introduces a sort of ‘WIndows Drag Factor’ to Linux. In reality this would perform faster than the Mac if run ‘properly’ (which I’ll get around to doing later)
Methodology (post your results below)
Preparation
To begin a test obtain the above image and run a batch using ‘Level of Detail’ set to ‘Thumbnail’ . This will be a very quick process as the output will be tiny images (you can delete the results as soon as they’re finished). The purpose of this step is to ‘prime the cache’. When DAE runs a batch it downloads all the Styles. We’re testing the speed of DAE here so by downloading all the styles as a throw-away batch we eliminate that part of the work DAE has to do (and we’re not testing your Internet speed here…).
It should be noted that if you run tests on different days there will always be at least one style you haven’t downloaded - the * Daily *
Reboot and exit everything
Reboot your machine. Fairly obviously this will mean that as much memory is free as possible.
Most likely, especially under Windows, a load of things load at startup as well. The ‘hidden’ icons can be found in your taskbar - click on the Icon I’ve circled in Red to see them all…
![]()
Hover over the icons you can now see and decide which ones you don’t really need. Leave things like Virus protection running but in my case I killed off Steam, Gog Galaxy, Epic Launcher and a few other things. They’ll all come back next reboot but at the moment they’re doing nothing useful and using rescources we want to use for Benchmarking.
The quitting stuff is less of an issue under Mac or Linux
TIming your session
Completely ignore the ‘Time remaining’ display when running a batch - its a guess. If you want to benchmark properly you need a very accurate stopwatch (there’s one built in - sort of…)
DAE stores a log of everything it does which is located at C:\Users\[Your Username]\.deeparteffects\debug.log in Windows and ~/deeparteffects/debug.log for Mac or Linux (note the ‘dot’ before deeparteffects in the file path!)
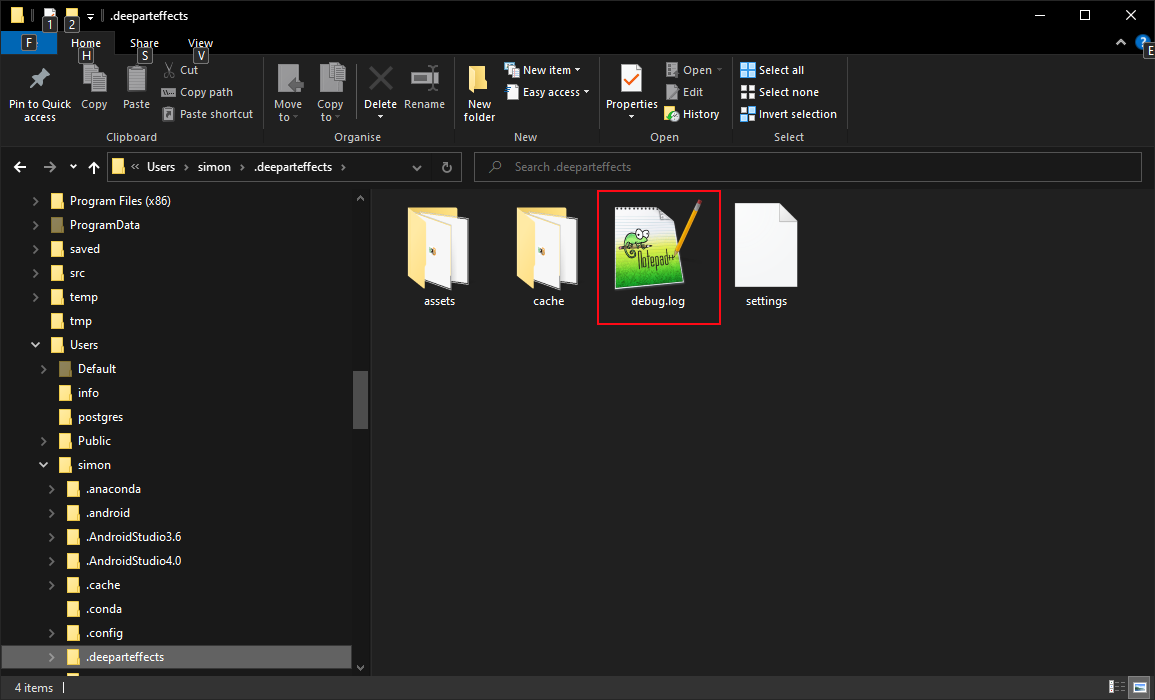
Before you start your test Delete that file. This is quite safe, DAE creates a new one if its missing and we want a log of what happened during your benchmark only.
We’ll come back to this file after the benchmark and it’ll have all the timings extremely accurately for your session.
If you don’t delete debug.log you’ll have a lot of old timings you’re not interested in (pretty pointless for what we’re doing)
Start DAE + set your test up
Start DAE, load the test image, set the Chunk Size (File → Preferences) and chose your output image size (Level of Detail). For my test I used Chunk Size - 2048 and output at ‘Very High’. To be meaningful for comparison you should run one benchmark with these settings as other settings will produce different timings. By all means repeat your own benchmark with whatever settings and images you like - the results can be quite interesting (well, they were to me)
If you’re using a GPU version of DAE you may find that your GPU can’t handle settings this high. In this case try a smaller image and / or smaller chunk size. You want to choose the highest numbers you can that run in a reasonable time. If you do this please share the image source using any required attribution along with your Chunk Size and Level of Detail settings so others (like me) can report our own results.
Run your test
Just start your batch using an empty directory and wait for it to finish - simple enough…
You may find it useful to occassionally move your mouse if your screen has a habit of blanking or you have a screen saver. Some machines drop their speed (Macs…) when in a state they consider ‘Idle’. Under Windows the power settings can have similar effects in some circumstances.
Assuming nothing bad happened once your benchmark has finished close DAE without doing anything else - this way the debug.log that DAE created at the start of your benchmark only contains information about this specific run.
Gather your results
You may have noticed that in my benchmark results above the timings are in thousands of a second. This is all possible from reading the debug.log file you just created while running your benchmark.
Open the debug.log file - there’s a LOT of stuff in here, it’s probably meaningless to many people but that’s fine as you only want two numbers and they’re easy to find.
First off search for the text “checking if available”. ThIs will appear all through the file but the very first occurrance marks the millisecond at which your benchmark started. It looks something like this…
2021-08-05 21:16:41,260 INFO c.d.r.s.ArtFilter [JavaFX Application Thread] preview 'c79859dc-1560-11e7-afe2-06d95fe194ed' loaded from disk!
2021-08-05 21:16:58,205 DEBUG c.d.d.c.a [Thread-18] tracked
2021-08-05 21:19:39,603 DEBUG c.d.r.d [Thread-32] using ARTFILTER... checking if available!
The first line in the above sample will repeat 10 or so times with slightly different data
The next line is that slight pause you get before anything happens
The last line, and the very first occurrance of “checking if available” is the batch beginning.
The date + time are what you’re interested in (unless you run a test over midnight you can ignore the date). Note that the time format is in European (German?) format with a comma (I change that to a point - do what you like with your own)
You now have the exact start time
Go to the very end of the file - the very last lines will look something like this…
2021-08-05 21:51:08,586 DEBUG c.d.c.s.e [Thread-32] Blending: 48 ms
2021-08-05 21:51:08,622 DEBUG c.d.c.s.e [Thread-32] Writing: 35 ms
2021-08-05 21:51:09,686 DEBUG c.d.d.c.a [Thread-482] tracked
The last timing recorded - as long as you didn’t do anything else and closed DAE after the test - is the exact end time so…
You now have the exact end time
Simply work out the time difference between the two - I use Time Difference Calculator - change the comma in the time to a dot/period/decimal place if you’re using that site though as it doesn’t understand the comma format of time (it’s a localisation issue - its not wrong, just different)
You now have the exact time your benchmark took to run
Finally... Share the results
All done. Include as much information as possible about your system. Be specific as possible as this will help others in the community make meaningful comparisons.
It’s quite likely you don’t know the exact CPU etc in your PC, For Windows I suggest you try CPU-Z | Softwares | CPUID as that is both free and very comprehensive when it comes to identifying things inside your computer you possibly only know vaguely about.
Some final thoughts
I’d ignore the images that result from any benchmark tests. The purpose of a benchmark it not to make Art, its to find out how long it takes to create the Art in the first place. No attempt was made in testing to make a pretty picture above chosing the original image. This was not an Art creation exercise, it was a number generation exercise.
If you look at the WSL image above and compare it to the actual timings from debug.log you’ll notice that the image shows 38:14 while the actual time taken was 43:24.720. As mentioned above the numbers DAE shows are based on what just happened so essentially a guess at how long remains.
DAE - how about adding a clear debug.log option in Help → About so we can reset the log file without hunting it down manually?
 ) and return to FULL SCREEN(□). This also held true for version 1.2.6.